

- Oct 1, 2015
- By Emily Inman
- In Content Marketing
A few weeks ago, I wrote about how using infographics is a marketing tactic that can help to “beef up” your blog content by breaking up the monotony of black-text-on-white-page, simplifying complex processes or ideas, and offering interesting and shareable content. Now that you know why you should be creating infographics, I’ll be sharing advice and resources that can help you get it done.
Getting Started
Content marketing processes can be time consuming, especially when it comes to creating attention-grabbing blog posts. With infographics, half the battle is coming up with an idea that will translate well into a graphic. But once you have your facts and statistics in place, it is relatively easy to create a design around them—if you have the right tools.
If you have a background in design, you may prefer to create your own graphics with Illustrator or Photoshop, and Creative Bloq has a handy, very nearly exhaustive, list of free design resources that can be helpful if you decide to go this route.
If you’re not an experienced graphic designer, or you don’t have the time to start a graphic from scratch, there are also plenty of online programs that offer all the tools you need to create your own graphics—fully editable, preset templates, icons, images, and fonts. Two of the most popular (and easiest to use) are:
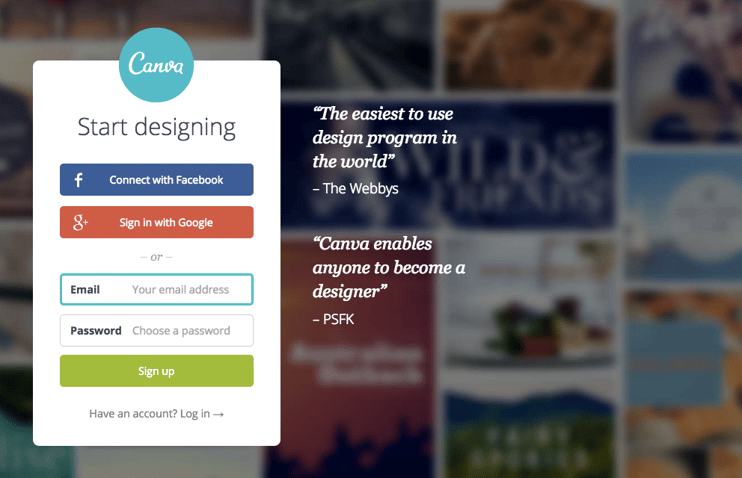
Canva
Piktochart
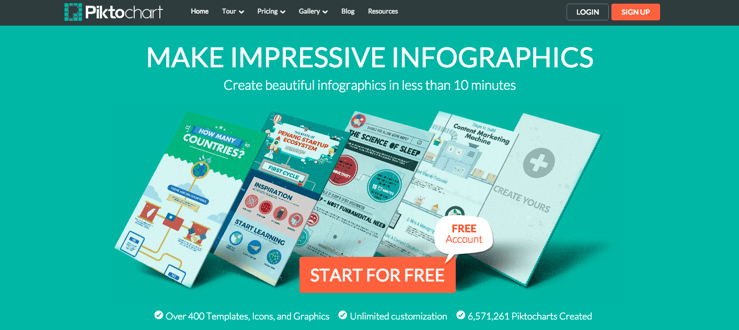
Both offer “freemium” services where signing up for a free account will give you access to a library of basic templates and presets. Certain graphics and templates are only available to paying members, but you can always build your own template from scratch and upload your own graphics.
Disclaimer: While I have created graphics in Canva, Piktochart is my preferred platform, but you may find that neither of these work for you, so don’t limit yourself. Explore the myriad other services out there that I didn’t include in my list.
Nailing Down the Design
If you’re creating an infographic on Photoshop or Illustrator, you may want to quickly sketch out a design before you get started. In fact, even if you’re working from presets on Canva or Piktochart, I would still recommend that you go in with at least a basic idea of what you want your infographic to look like. Otherwise, you’re going to spend a considerable amount of time staring at a blank template trying to figure out just how in the world you’re going to give this thing a cohesive design. Trust me on this.
Even if you aren’t artistically inclined, it can help to map out a barebones layout on a piece of scrap paper. I mean, I’m no Rembrandt, but even I can scribble a couple lines and random geometric shapes to stand in for my text and graphics. It doesn’t have to look good, it just has to work.
Putting the Picture Together
As you’re working with a visual medium, it’s the image you use that really brings your infographics to life. But as most infographic platforms offer only limited options for free, you’ll need to get a little creative if you don’t want your infographic to end up looking like a variation on someone else’s theme. To supplement the gallery of images at your disposal, I highly recommend the following resources:
- IM Free was built specifically for web designers, but the free resources available on the website—icons, high quality images—are also quite useful for infographics. Images are divided into categories like “People,” “Education,” and “Nature,” but the website is also 100% searchable.
- Life of Pix is an interesting assortment of high-res, public domain photos from the LEEROY creative agency in Montreal. The website already boasts an extensive, searchable gallery (65 pages of images), and new photos are added on a weekly basis.
- New Old Stock curates a vast collection of copyright-free antique photographs. The website isn’t searchable, but if you’ve got some time on your hands, the gallery itself is certainly interesting enough to warrant a look.
- Pixabay offers hundreds of royalty-free images (photography, vector, illustration) in a searchable database; attribution is not required for most images, but you may want to check the license before you download.
- StockSnap.io has a searchable gallery of thousands of stock photos. All the images are released under creative commons public domain, so they require no attribution.
Developing a Final Product
Your infographic doesn’t need to be overly complex. As long as it has a clear point and is visually appealing, it’s doing its job. Whether you use it to explain a concept or even present interesting research to your blog viewers, they’ll appreciate having something to look at that’s not just text on a web page. Take advantage of the free, easy-to-use resources outlined here, and you’ll be giving your audience something interesting to look at—and share—in no time.