

- Aug 31, 2015
- By Emily Inman
- In Content Marketing

One of the greatest foibles that many content marketers—myself included—often fall victim to is overproduction. In marketing, publishing an overabundance of blogs is, in theory, a good problem to have if you’re trying build a reputation for thought leadership and boost your search engine ranking. A constant stream of fresh content does build your credibility and means more pages for Google to crawl and index to bolster your search rankings, but all the blogs in the world aren’t going to help you convert leads if you aren’t capturing the interest of searchers—even if your content turns up on that coveted first page of results. You need to make sure that your content is creating enough interest to keep visitors on your site.
Infographics can help you do that in three ways.
1. Break up the Monotony
By this point, you likely already know that you need to format individual blogs with headers, images, and whitespace to keep readers interested—nothing will have a visitor navigating away from a blog faster than a piece that’s an unbroken wall of text. And the same principle holds true for your blog as a whole. You need to mix up the types of content you post. While traditional, article-style pieces may hold greater SEO potential, infographics have a different kind of value.
Much like how a solid block of text in a blog can cause visitors to navigate away from the page without reading, a blog that just offers up the same kind of articles, formatted the same way can cause readers to lose interest in your content. The occasional infographic can be a good way to change things up and keep visitors scrolling through your blog.
And don’t fear that having a blog replaced, every so often, with an infographic or other graphics-heavy post is going to harm your search engine rankings. Google actually indexes images, as well as page text, so you can still optimize your infographics posts for search value. Treat the infographic like you would the image in a text-based post and include the keyword you’re trying to rank for in the alt tag of the embedded image. You can even write a brief introduction and/or conclusion, in place of the traditional caption, that includes the keyword, if you want to make sure that every page you create is fully optimized.
2. Simplify a Complex Process or Idea
If you work in a complex or technical field, your sales team may find themselves educating potential clients on the intricacies of your industry.
Your blog is the perfect repository for such content. Blogs offer a way for you to standardize and control explanations of detailed concepts or frequently asked questions and let your salespeople get back to what they do best—selling. Potential client have a question about how one of your services would affect production? Sales people can direct them to the post on that topic or use the blog as a template to answer the question. Sometimes, however, even a written explanation of processes or facts can overcomplicate things and create confusion (if you’ve ever had to write anything about how Medicare coverage works, you know how painfully true this can be).
Some explanations benefit from an economy of words—or from having no words at all, distilled down into a graphic representation.
Earlier this year, I created an infographic for one of our clients in the food manufacturing industry that did exactly this.
Sous vide, a cooking technique where cuts of meat or other foods are sealed in plastic then slowly cook in a water bath, is rapidly gaining popularity among foodies and home cooks, but few companies have adopted the method at an industrial level. Our client, SugarCreek, needed a simple way to explain the their particular sous vide process to food brands that weren’t yet familiar with the methodology or had questions about how such a process could be scaled.
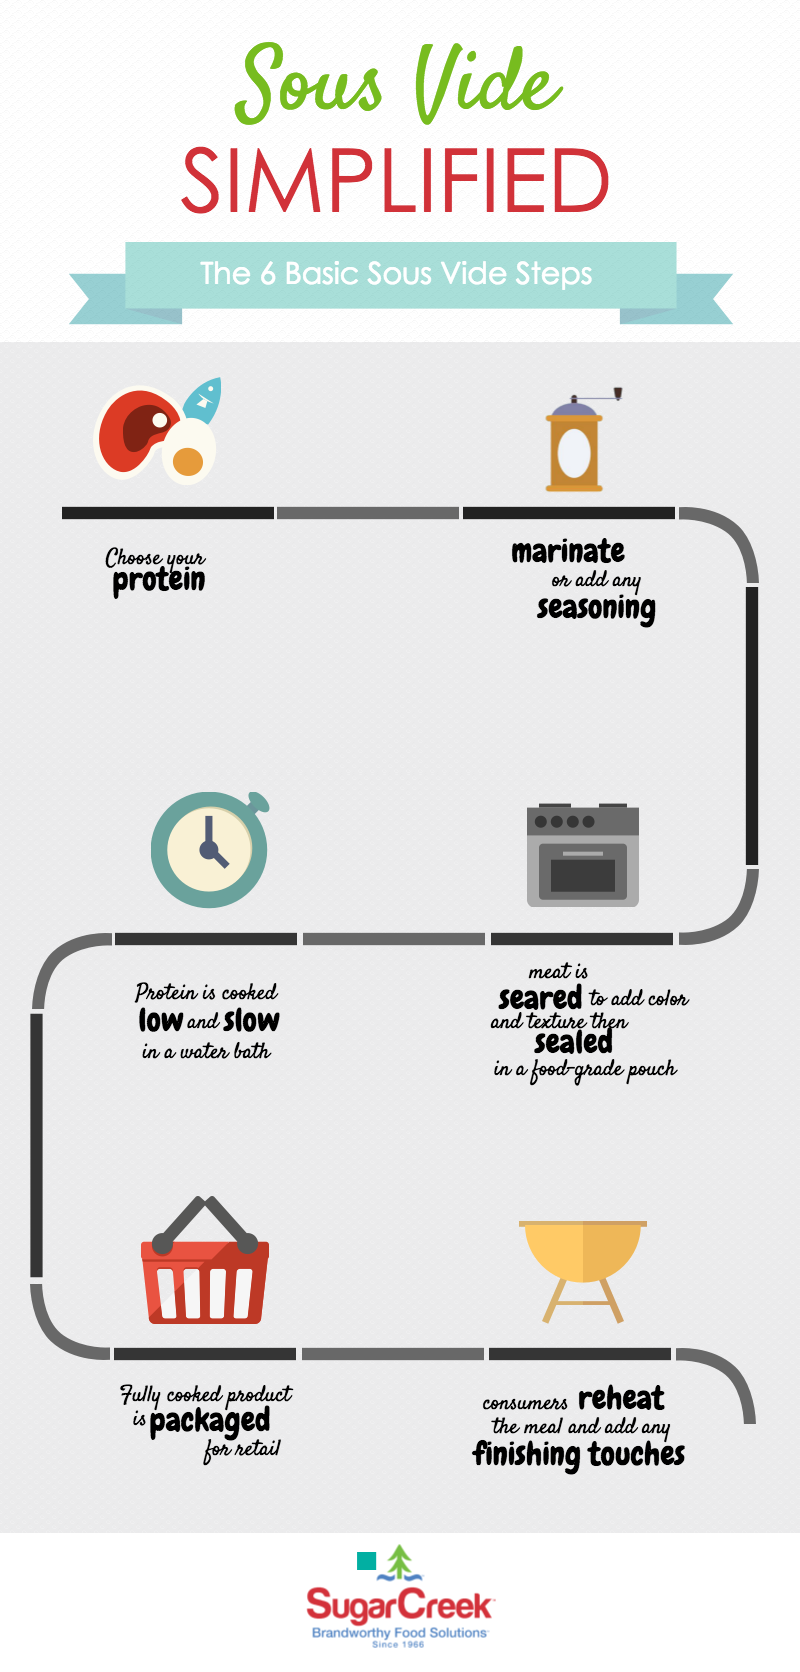
I simplified SugarCreek’s industrial sous vide process into 6 steps, which covered all the major points, and created an easy-to-follow infographic that could easily be shared with customers and found online.
Even if what you do is fairly straightforward, there are undoubtedly elements within your industry where customers could benefit from a simple, visual explanation.
3. Spark Interest
Infographics are supremely shareable. They look great on a blog page and do well on most social media platforms: Twitter, Facebook, Pinterest, even LinkedIn. And, as with other visual content, they have the potential to go viral. The sous vide infographic that I created for SugarCreek has proven to be the most popular post from this year—the fourth most popular of all time.
Shake Up Your Blog’s Norm
To stay at the top in your industry, your marketing strategy needs to capitalize on creative ways to demonstrate your thought leadership. Yes, blogs can contain new ideas that your competitors haven’t touched on yet, but going a step further to illustrate those ideas in a sharable way can increase your marketing success even further. Stay tuned for next month’s post to learn some tips and tools for creating original infographics and improving the quality of your blog posts.